Recreational center usage: how does it affect grades?
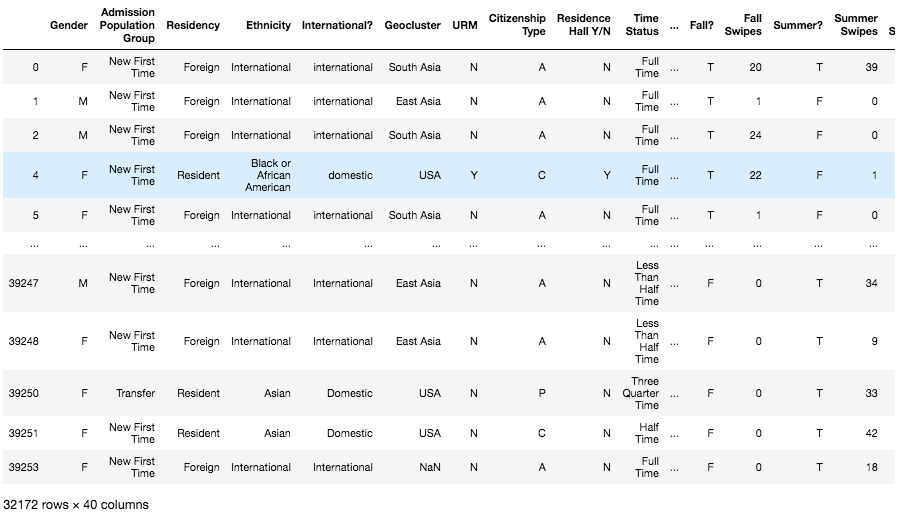
I was fortunate to get access to a large volume of data of student swipes at my university’s recreational center. This is all swipes for a complete academic year, anonymized of course.
Exploratory data analysis and data cleaning
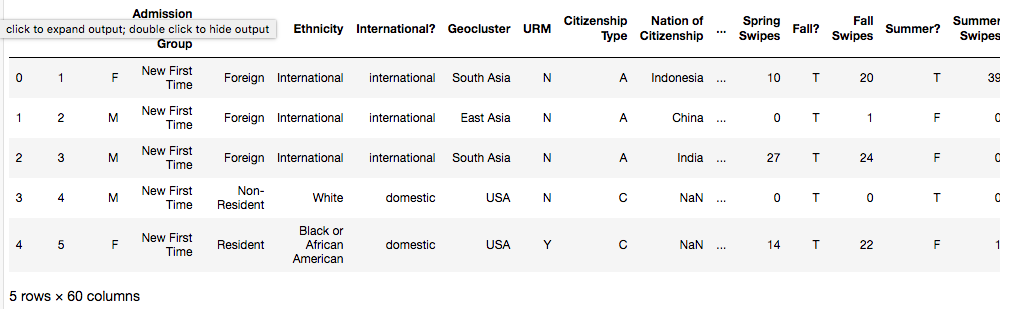
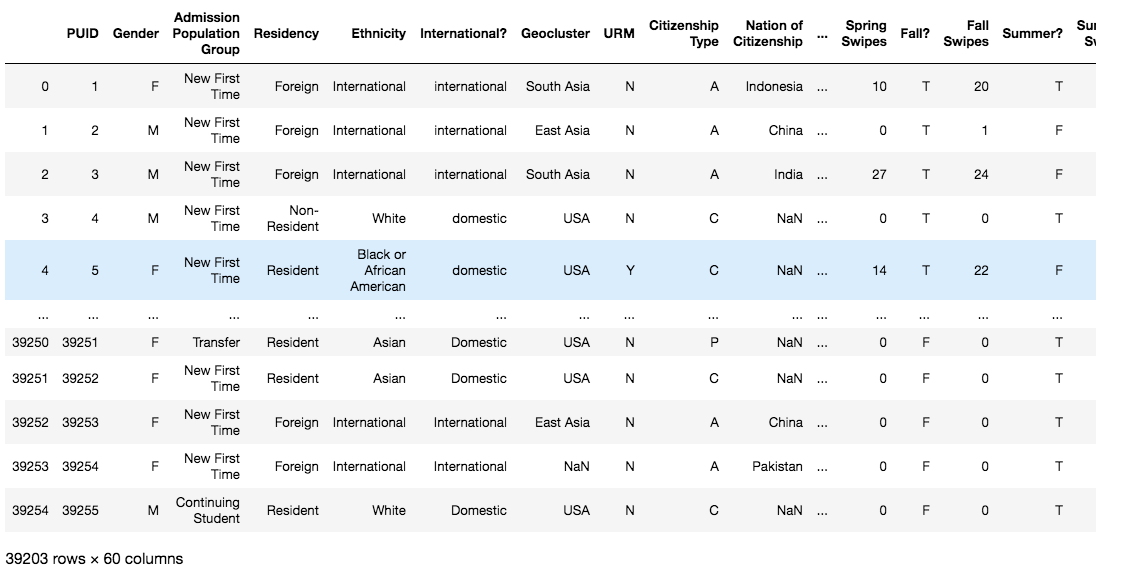
Pandas Profiling has been a game-changer since I found it. Excellent to get a good first dive into the data.
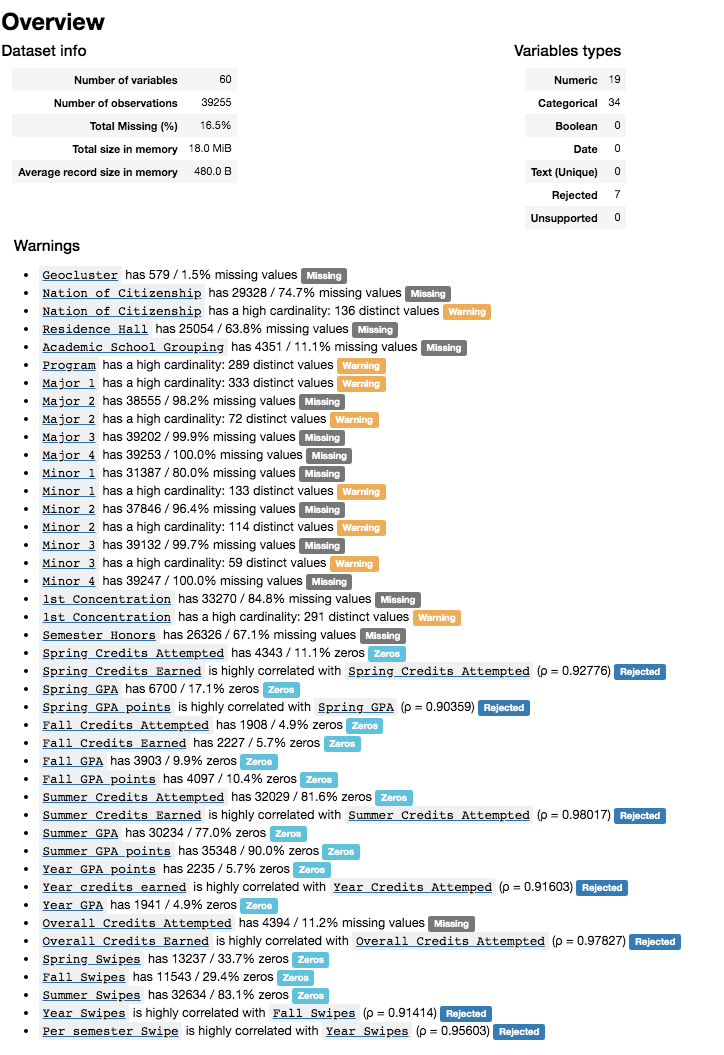
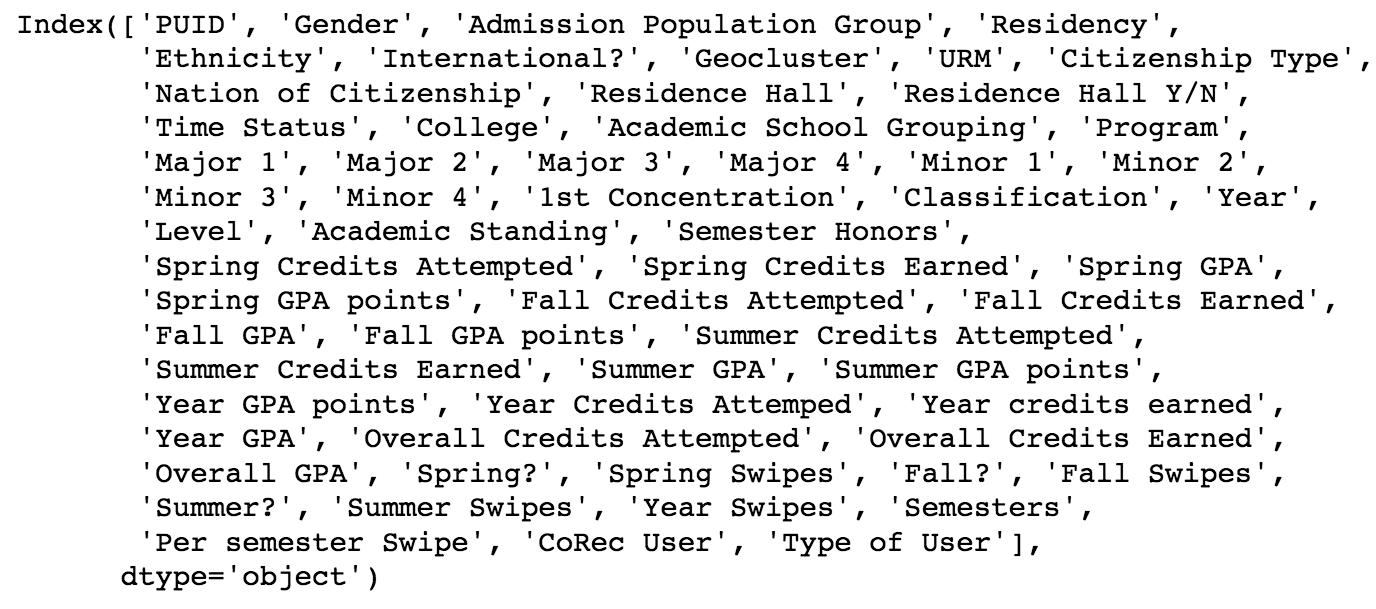
Yikes, that’s 60 columns. But there are a lot of columns that are highly collinear and some others that are missing a lot of values. We will remove these as they contain no information. We will use the results from our earlier profiling to select the columns to delete. We will remove all columns that have >50% missing values, which is not a totally unreasonable thing to do. It also happens that it is intuitively unlikely for these columns to have any effect on the outcome.
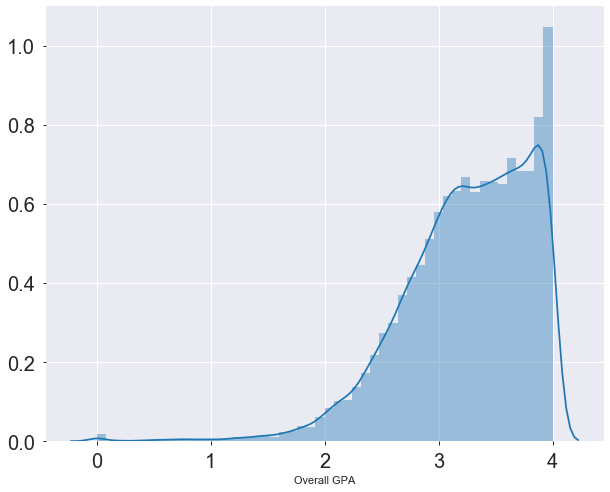
Frequency of use versus student GPA
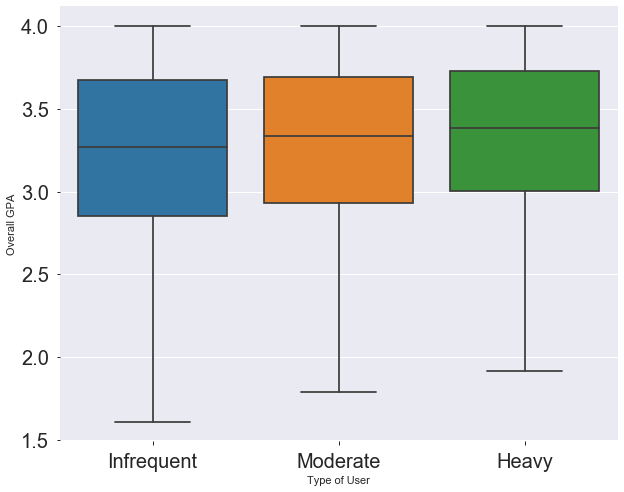
This is a fantastic early indication that the frequency of use is strongly correlated with GPA.
data['Type of User'].value_counts()
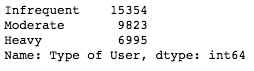
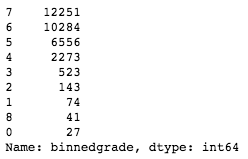
It looks like these classes are imbalanced.
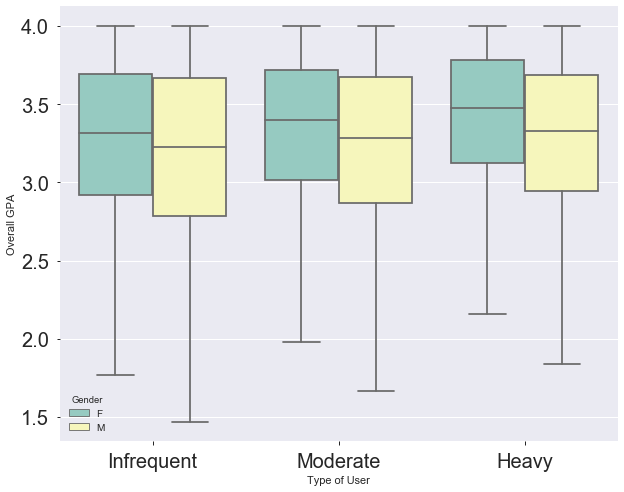
Role of gender
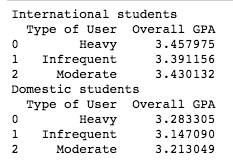
International students
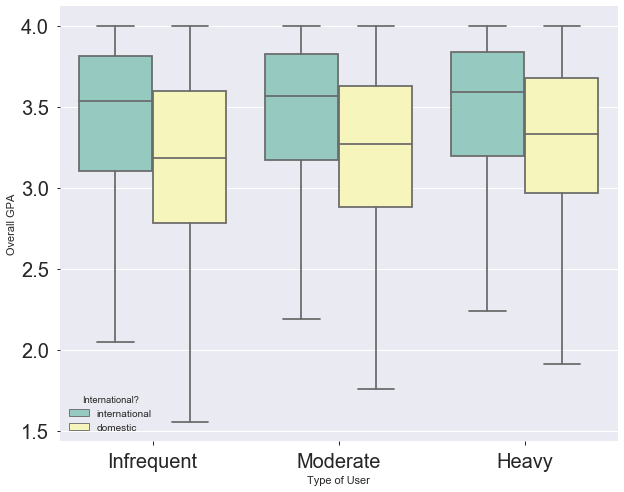
Surprising to me that international students have such a high average GPA compared to domestic students.
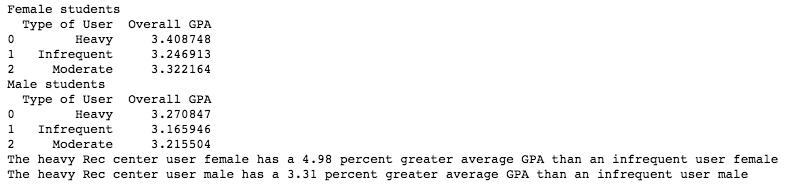
It seems that being a regular recreational center user has a more pronounced influence on the GPA for women.
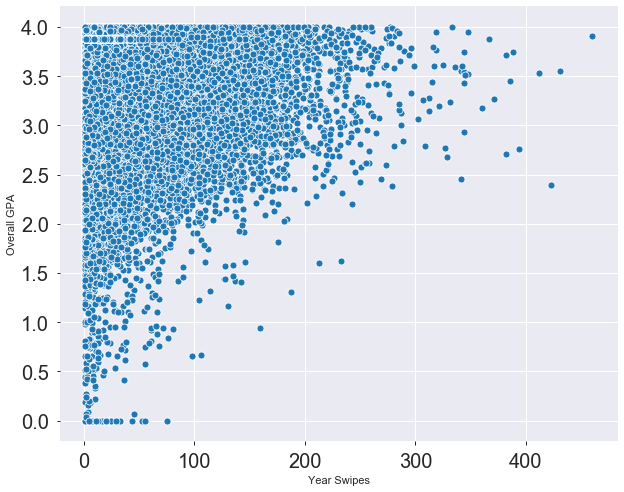
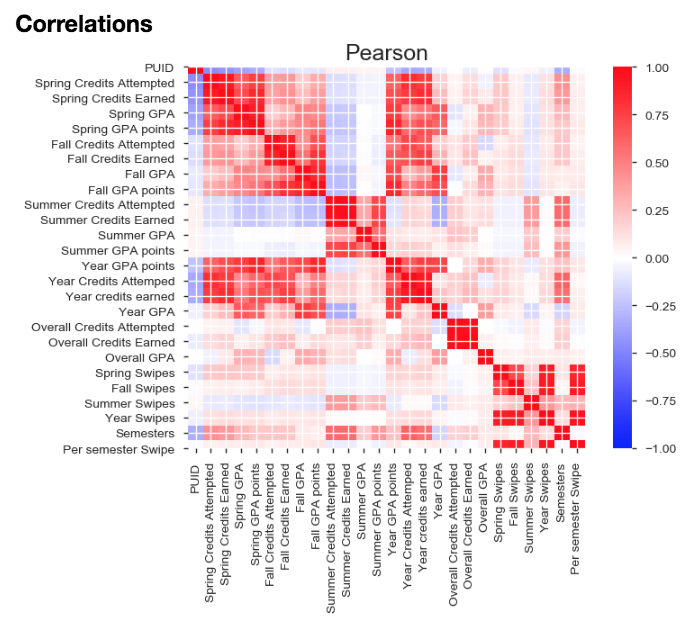
There is definitely some weak correlation between number of swipes and overall GPA.
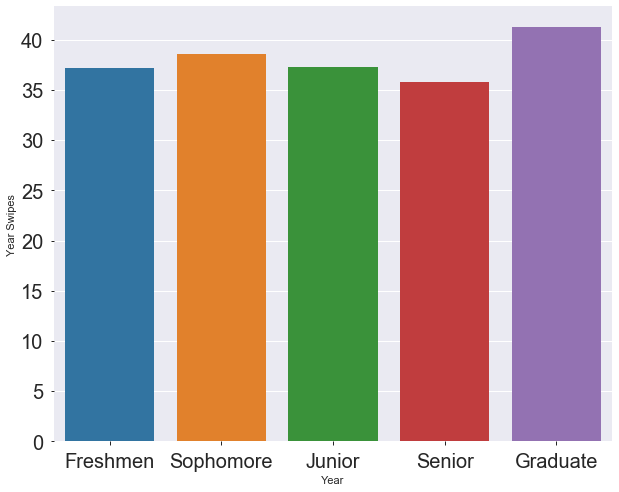
Graduate students tend to be more active.
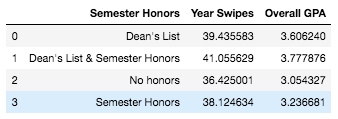
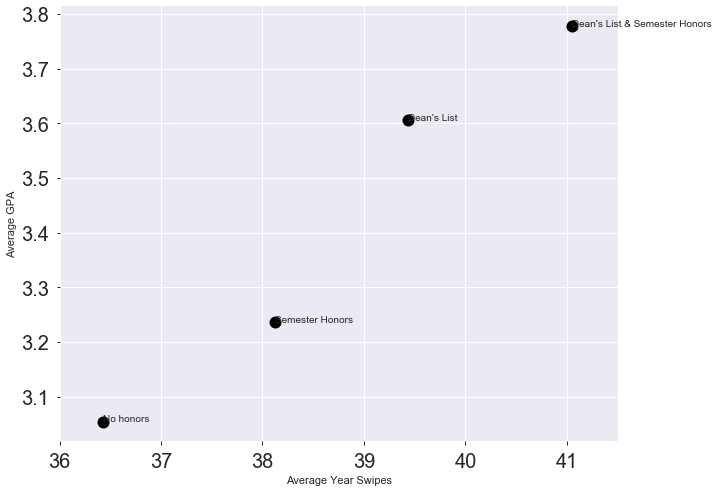
Honors students
Let’s try to predict GPA classes
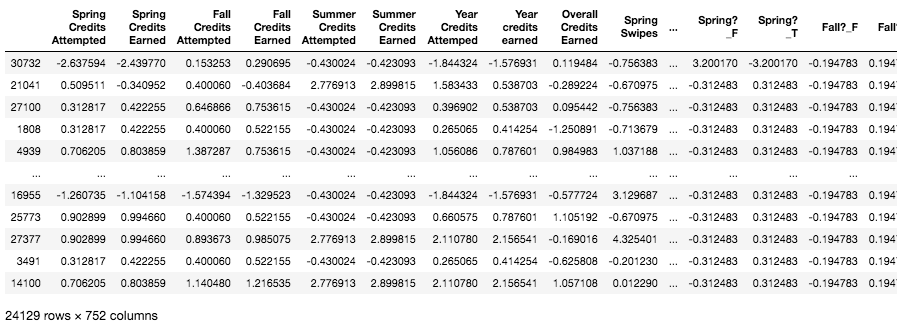
Total Features: 25 categorical + 15 numerical = 40 features
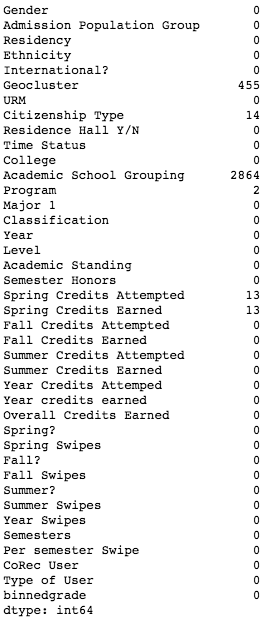
We have to be careful about how we handle the missing values - for instance, NaN for residence hall could just mean that the student did not use on-campus housing. So, NaN in that case could actually provide useful information. From the above breakdown, this is what we will plan to do with the NaN values:
- Geocluster: Impute with mode
- Citizenship type: Leave as is- i.e., forms a unique value of its own
- Academic School Grouping, Program: Impute with mode
- Year GPA: Impute with median
- Semester Honors: Leave as is
- Spring Credits Attempted, Spring Credits Earned, Spring GPA: impute with median All this magic happens below:
Now we are on to encoding the features. The categorical features are encoded using OneHotEncoder, the output is encoded using Label encoder.
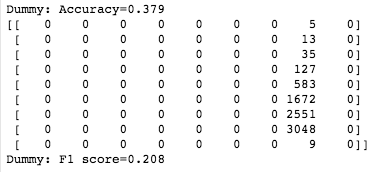
Looks great. Let’s train and test then. We will start with a dummy classifier.
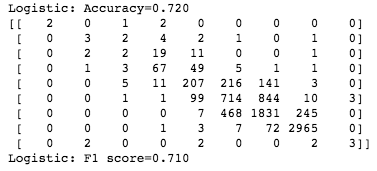
We are not done yet. Our results are strongly dependent on the test/train split of our dataset. Based on the input random_state value, our prediction parameters will vary. We can address this by running the model on a bunch of test/train datasets as below:
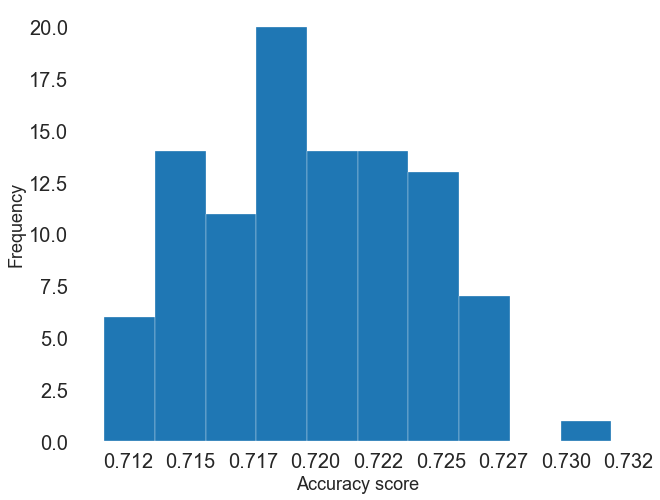
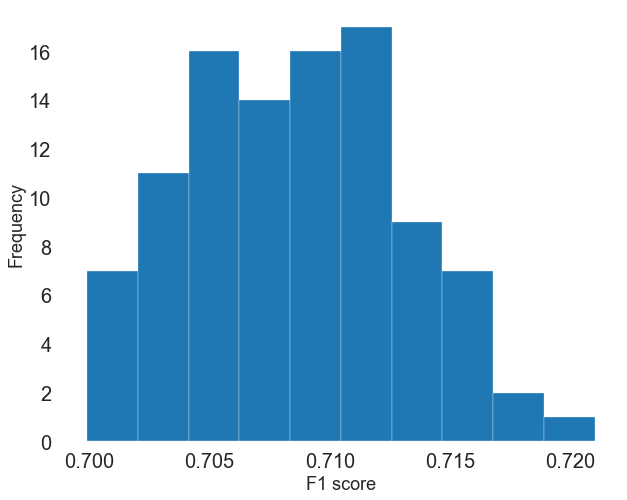
The above distribution provides us confidence that the predicted accuracy and F1 score are in the same range as we saw previously.
Conclusion
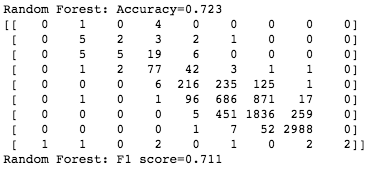
The moral of the story is “Study hard but also make sure you stay physically active”. And also, we can predict your GPA with 72% accuracy. It seems like staying physically active has a non-trivial effect on academic performance.
Following were some of the interesting observations:
- In general, student who use the rec center regularly had a higher average GPA.
- Female students have a higher average GPA than male counterparts and the effect of being a heavy rec center user are more pronounced for them.
- International students tend to have higher average GPA.
- Honors students use the rec center more and have a higher than average GPA.
- We can predict the GPA class of a student from other characteristics and frequency of use with a reasonable accuracy (72%).