A primer on k-means clustering algorithm
K-means clustering is a basic vector quantization algorithm used to cluster n-dimensional data. This is, unsurprisingly, used in cluster analysis, where the k clusters are partitioned such that each observation belongs to the cluster with the nearest mean.
The algorithm
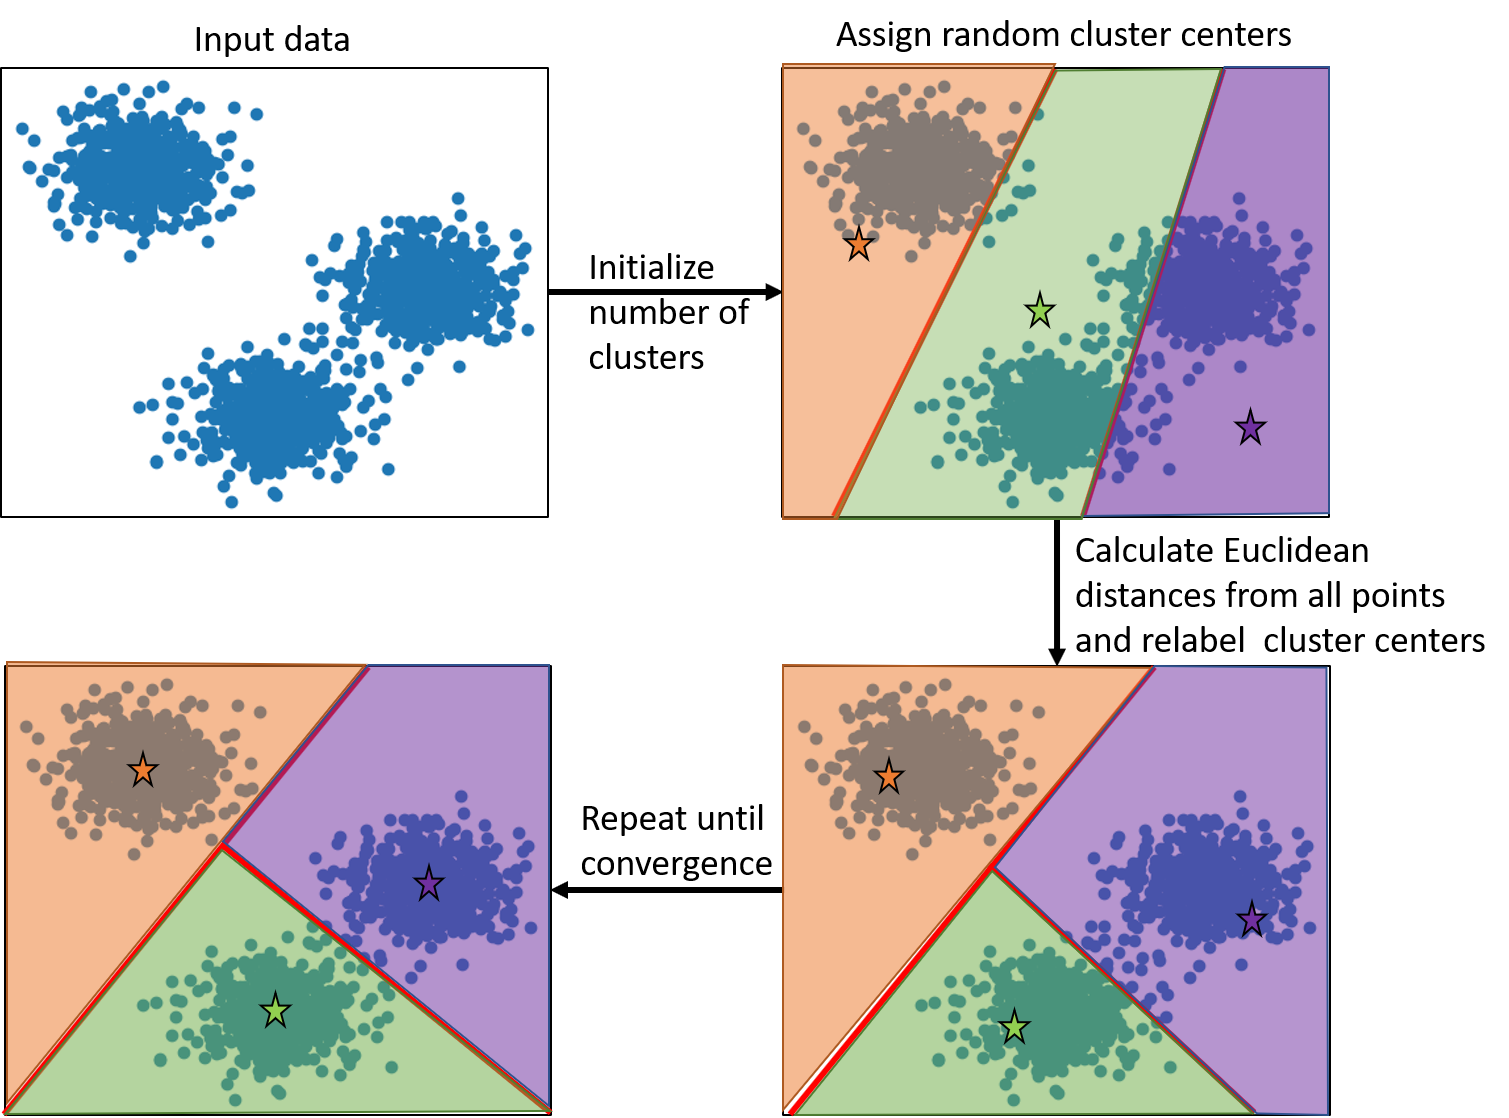
The basic algorithm involves the following steps once we have the input data. The algorithm is also explained using the schematic representation below.
- The number of clusters are initialized. This value is usually known, but in cases where this is not known a priori, an initial value is chosen which later needs to be iterated over.
- Based on the input number of clusters, the cluster centers are randomly assigned.
- Then, we loop over all the points to calculate the Euclidean distances between the points and the cluster centers.
- The points are reassigned labels based on the nearest cluster centers.
- Based on the new labels, the cluster centers are recalculated.
- This procedure is continued till convergence is reached.
Application
We will now look at some simple examples where k-means clustering can (and cannot) be used. The first thing to note here is that the number of clusters will need to be decided by the user. There might be cases where there might be more than one answer.
import matplotlib.pyplot as plt
from sklearn.cluster import KMeans
from sklearn.datasets import make_blobs

n_samples = 2000
random_state = 400
X, y = make_blobs(n_samples=n_samples, random_state=random_state)
y_pred = KMeans(n_clusters=3, random_state=random_state).fit_predict(X)
plt.scatter(X[:, 0], X[:, 1], c=y_pred)
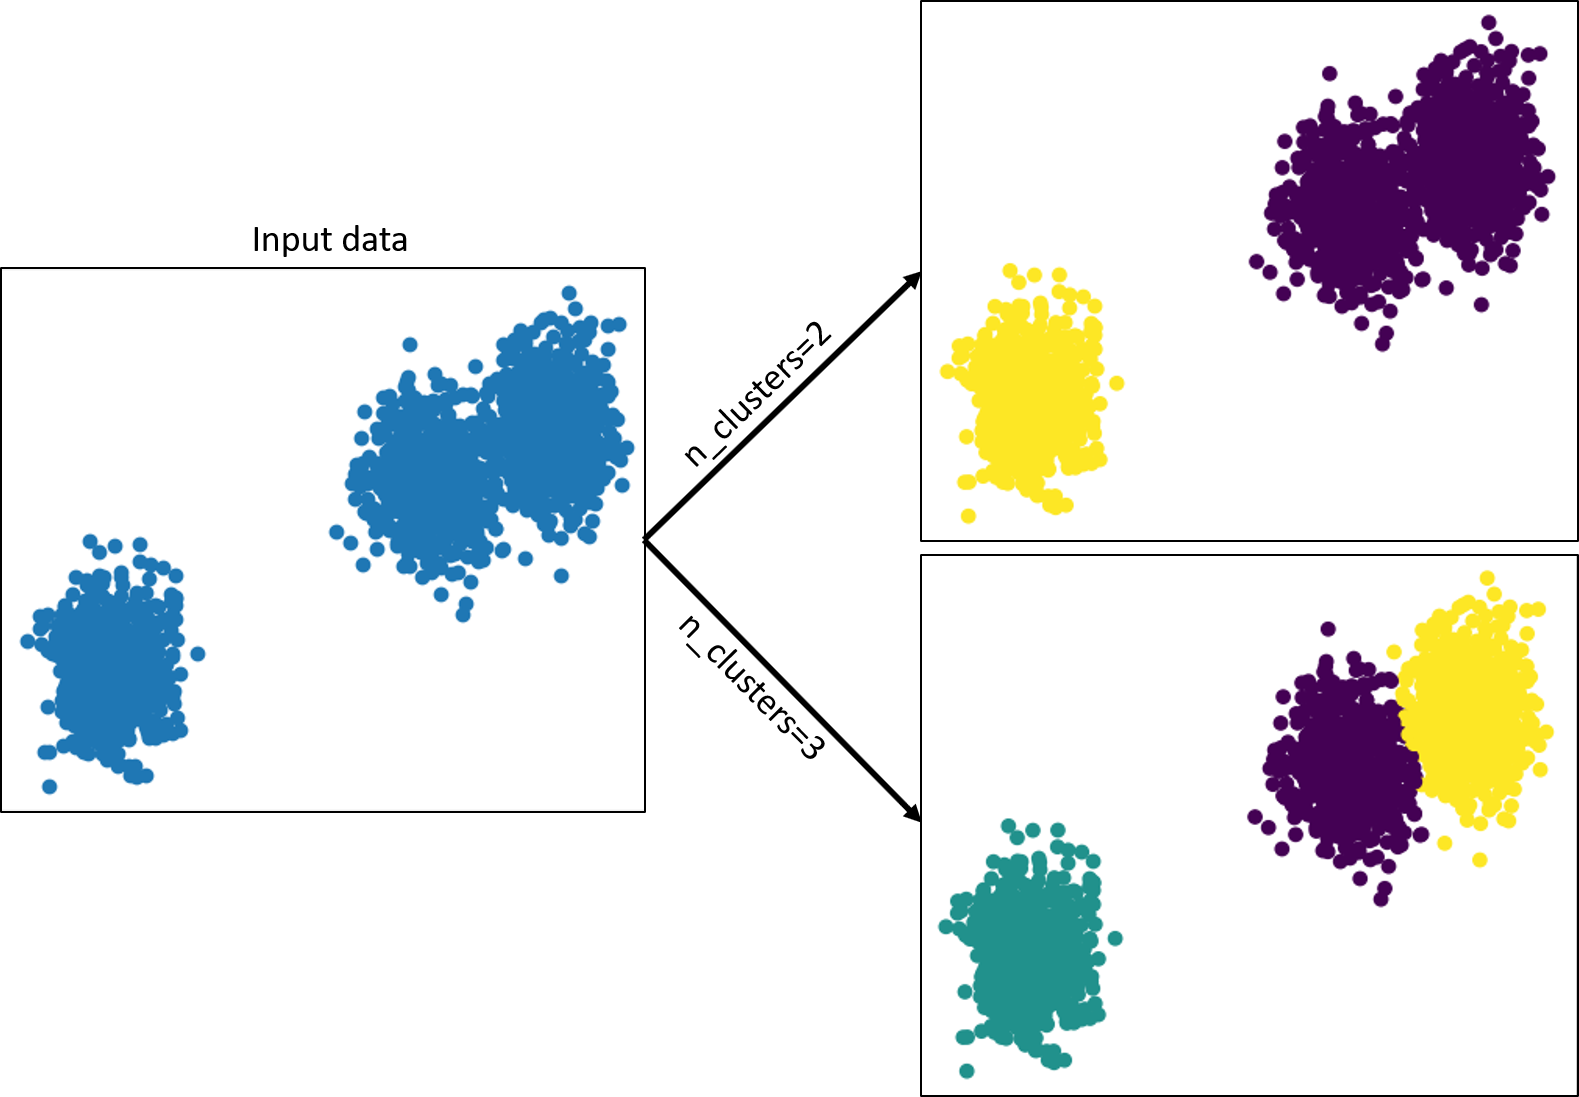
In the above example, based on the number of clusters, we obtain two ‘correct’ answers. The correct answer in reality would depend on the nature of the problem at hand, and is not readily evident from the data itself.
Another important point to note is that since this algorithm relies on Euclidean distances, the data need to be distributed in a circular/spherical manner. Shown below is an example of non-circularly distributed data where this algorithm fails:
X_varied, y_varied = make_blobs(n_samples=n_samples,
                                cluster_std=[1.0, 2.5, 0.5],
                                random_state=random_state)
y_pred = KMeans(n_clusters=3, random_state=random_state).fit_predict(X_varied)
plt.scatter(X_varied[:, 0], X_varied[:, 1], c=y_pred)

Note that k-means clustering can also be applied to higher dimensional data. The clustering would still be based on Euclidean distances in n dimensions. In summary, k-means clustering is a simple yet powerful tool for clustering datasets.
Here is another simple example of k-means clustering used for a real-world dataset.