Analysis of New York City traffic data
Introduction
One of my first projects aimed mostly at familiarizing myself with the pandas dataframe was on the NYC traffic data. Here, we are reading in a dataset of traffic violations downloaded from https://data.ny.gov/Transportation/Traffic-Tickets-Issued-Four-Year-Window/q4hy-kbtf. The intention is to extract useful patterns in traffic violations that will be helpful for the police department in order to better manage traffic violations. Also, this analysis could potentially be useful for the everyday commuter. For this project, I used a public dataset released by the New York State DMV for traffic violations in a four-year window between 2013 and 2016. Data extracted from records of tickets on file with NYS DMV. The tickets were issued to motorists for violations of
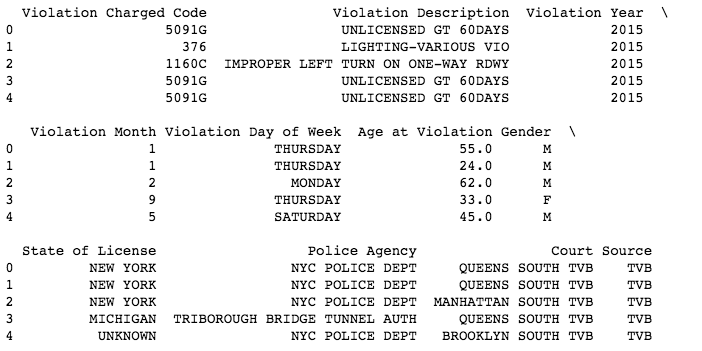
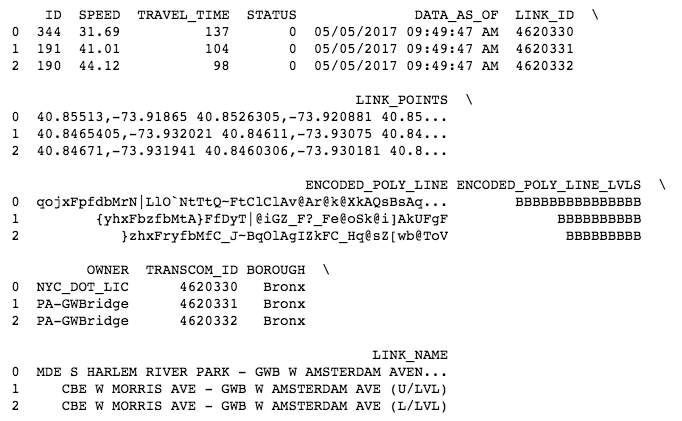
We start off by loading the dataset as a csv file. This raw dataset contains 1.5 GB of data with about 3 million rows. Let’s read in this data into a dataframe and view the data.
Let’s jump into the analysis. For starters, let’s look at which months have the highest number of violations. At this point, it would be expected that the summer months have higher number of violations simply because there are more drivers on the road. But we shall see.
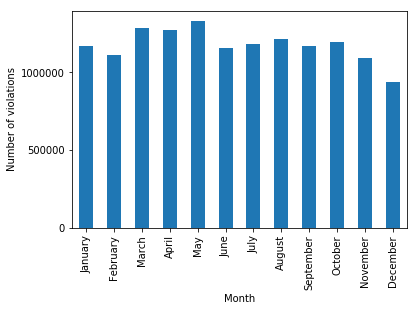
While we are seeing that the highest number of violations are committed in the months of March-May, it is rather surprising that the months of June-September (which would involve large amounts of travel) having a dip in the number of violations.
Next, let’s look at the distribution of traffic violations on different days of the week.
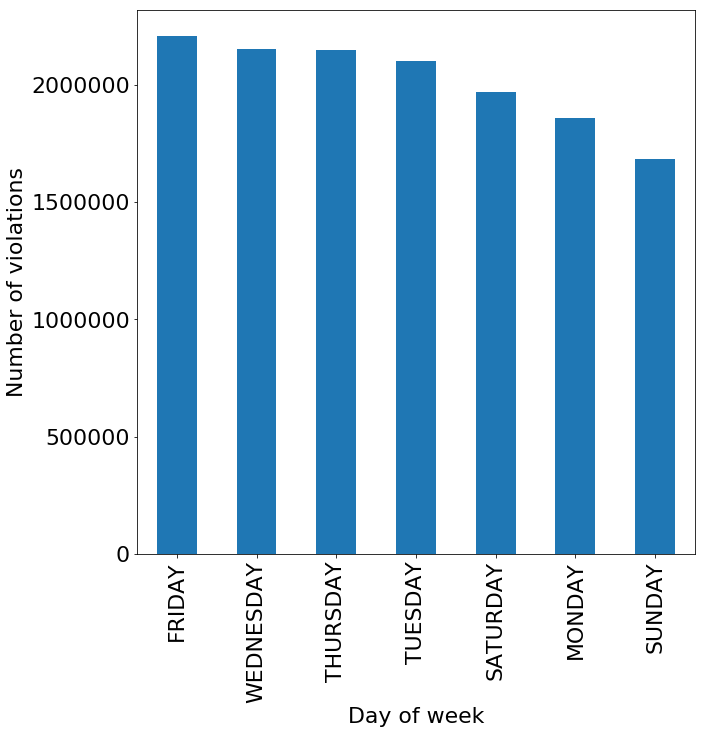
I am suspecting that a large percentage of violations that happen on Fridays are drunk driving violations.
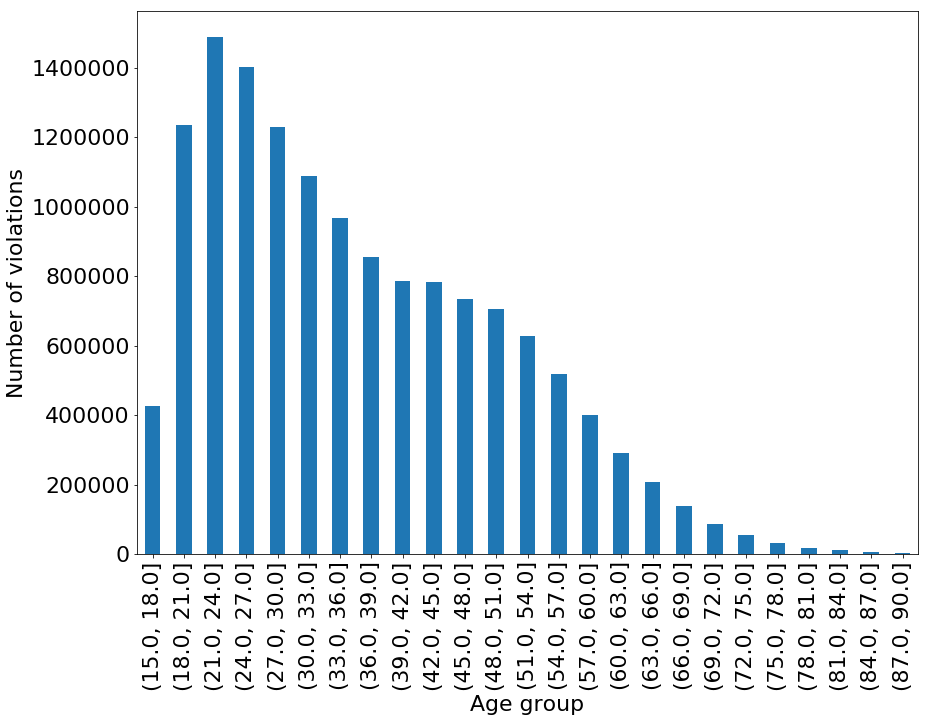
How does Age play a role?
Let’s also look at the ages of violation. We can expect younger people to commit more traffic violations due to lack of experience.
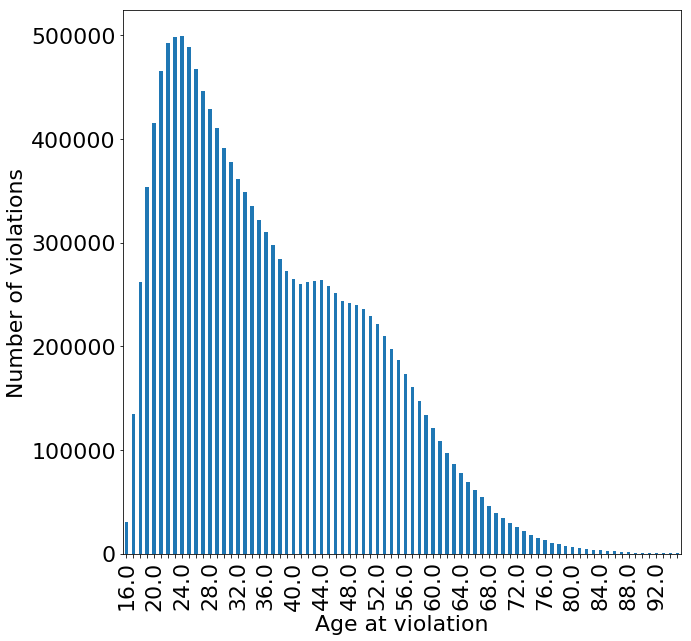
It is interesting to note that there is almost a bimodal distribution of violations, with one peak around the 21 year old mark and another at the 44 year mark.
We can also bin the data into different age groups to help further analysis.
Speeding violations
Next, let’s take a closer look at the speeding stats. For this, we will find all violations that have the phrase ‘speed’ in them.
Speed statistics from traffic cameras
In order to look a closer look at the speeds as observed by traffic cameras, I looked at the public dataset provided by the NYCDOT’s Traffic Management Center. This data is downloaded from https://data.cityofnewyork.us/Transportation/Real-Time-Traffic-Speed-Data/qkm5-nuaq. This is a fairly large dataset with millions of data points. They also provide geographical data with which we can get maps of speeding as well. We will read in the data and plot out the observed speed values based on the latitudes and longitudes of the speeds. We consider speeds of over 65 mph for plotting.
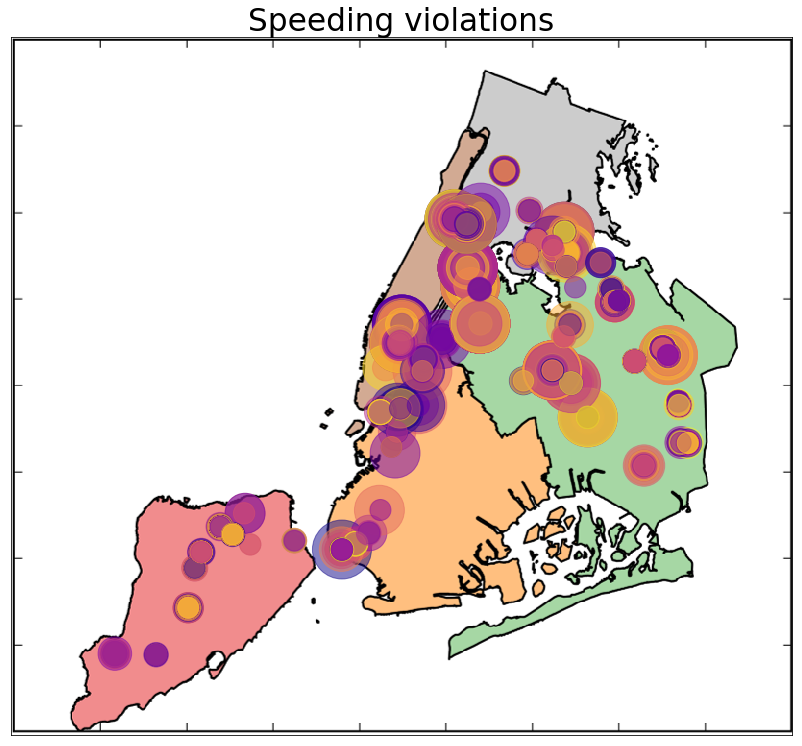
This map gives a distribution of the speeding violations (>65 mph) as measured by the traffic cameras. The sizes of the circles represent the speed.
Conclusion
So there were some interesting observations made here. But this remains a preliminary analysis. More to come soon!